With current stats highlighting a nearly 10% decline in retail sales YOY, it’s no surprise that the retail industry will experience an influx and volatility in inventory levels. Knowing the right metrics to measure your inventory against can help you understand the degree of impact to your business and what your future might hold.
While topline sales provide a visible indication of performance, actual business profitability relies heavily on proper inventory management. Depending on their size, brands can spend anywhere from 50-80% of their budget on inventory. The role of inventory managers is to turn this budget into profit for their company as fast as possible. Doing so inaccurately will result in expenses beyond the constraint of cash. Costs associated with storage, movement, and markdowns all add up to make inventory management a critical component to the health of any retailer. Measuring your inventory against the following KPIs is the first step in strategizing inventory plans and setting yourself up for success.
GMROI
Short for gross margin return on (inventory) investment, GMROI is perhaps the most crucial metric of profitability for planners who buy low to sell high. GMROI is essentially the degree to which a product yields financial gain as measured by a price to earnings ratio. It is calculated as gross margin divided by average inventory cost to show margin relative to the investment. While ideal rates vary by industry, generally a higher GMROI signifies a “healthier” product. Alternatively, anything below a rate of 1 would imply negative returns. Though like any metric, GMROI should be assessed in tandem with other KPIs as what proves to be strong in one area may not apply to others.
EOH Inventory
Quantified at units, cost, and retail, ending on hand inventory (EOH) reflects the sum of all units for the last day of the selected time range. EOH helps identify how much inventory is available by channel, location, and season. Combined with WOS, EOH is used to understand the longevity of inventory. With this information, a planner or merchandiser can know what is considered “stale” inventory and reallocate it to other locations or channels where needed. Without the insights attached to this metric, brands may turn to discounting as a short term strategy to offload cash constraining inventory. Fuse Inventory Control tracks ending on hand in real time across every SKU and location, so your inventory KPIs are always current.
WOS
Weeks of supply, or WOS, is a measurement for safety stock as it relates to your future demand. WOS acts as a metric to value the life of inventory on hand in weeks. In other words, how many weeks it will take for an item to sell out based on current on hand inventory and future projected weekly sales. WOS is calculated as inventory on hand divided by future average weekly sales.
Note, WOS is different from WOH (weeks on hand), which is based on current average weekly sales as opposed to future. Put simply, WOH looks backwards while WOS looks forward. WOS is a better metric as recency is not always indicative of immediate future sales such as those seen during major shopping holidays. Though, in absence of a forward looking forecast, WOH can be used to determine an estimated life of inventory. Fuse Demand Planning calculates forward-looking WOS daily by SKU, so you're always working from an accurate picture of supply coverage.
Ideal rates of WOS will vary depending on an individual’s level of risk aversion. While it is safer to carry more inventory to offset losses from demand volatility, carrying too much puts one in a cash constraint. Targets will also vary depending on your lead time and ordering cadence. If your lead time is say 6 months and you order once per month, carrying just 2 weeks of supply won’t cover much demand if you oversell.
A general good rule of thumb is to carry the week equivalent of your monthly lead time. In the case above, 6 weeks of supply will adequately cover existing demand as well as a decent level of volatility. WOS should be adjusted by product to optimize your inventory position. Meaning, for products you’re okay with selling out of, a lower WOS could be justified so that you can carry more inventory in the things that bring you more value.
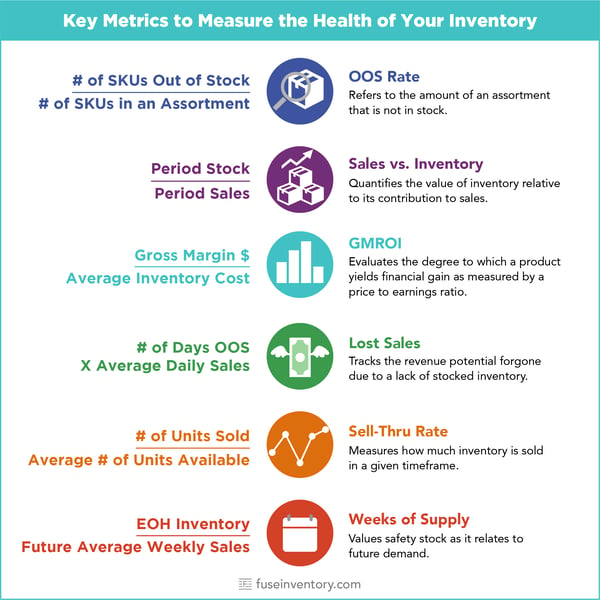
OOS Rate
Out of stock (OOS) rate is the inverse of an in-stock rate and refers to the amount of an assortment that is not in stock. It is calculated as SKUs not in stock divided by total available SKUs. The importance of calculating an OOS rate is to measure the customer shopping experience and well as to quantify lost sales.
When it comes to the shopping experience, increased levels of OOS can cause customer frustration and erode brand loyalty. While some believe OOS products can signify increased desire and therefore even stronger demand, the argument has yet to be quantified. Retailers should target OOS rates below 10% in order to protect the shopping experience and limit lost sales.
Lost Sales
As mentioned above, OOS products can lead to lost sales or the frequency at which a customer asks for an item that is not in stock. Factors that are important in this calculation include average daily demand and time until the next receipt. Average daily demand is equal to the current period forecast divided by the number of days in the period. You would then multiply this by the # of days out of stock until the next delivery to quantify the level of lost sales. A strong demand planning program prevents lost sales by catching stockouts before they happen. Fuse Demand Planning quantifies stockout gaps in units and dollars and shows exactly when you'll run out and when the next shipment arrives.
Sell-Through Rate
Sell-through rate (%) is a measurement of how much inventory is sold in a given timeframe. This metric compares the amount of inventory on hand against the amount sold and is calculated by dividing the number of units sold by the average inventory on hand for that specific period. Average inventory takes into account the beginning on hand inventory plus anything that was received so as to quantify what was available to sell. Calculating an accurate sell-through is vital to understanding the performance of a product. Sell-Through rates help brands estimate how quickly they can sell a product and convert their initial investment into revenue.
Sales vs. Inventory Ratio
Also known as a stock-to-sales ratio, this metric helps brands understand the value of inventory relative to its contribution to sales. The higher the ratio of sales, the better the category is performing compared to others. A lower ratio signifies either a surplus of inventory or low sales.This metric, calculated as period stock divided by period sales, can help a business with future product decisions. It helps identify categories that a brand can further grow or those that should be discontinued.
What’s in the numbers?
The most important thing about analyzing your inventory is to do so consistently. Pick the metrics you find most valuable and monitor them on an ongoing basis. Compare both periods of time and products against each other to gain a better understanding of your business. Having the right tools in place will help you easily monitor these metrics in a timely manner and help you plan a more profitable business.
This article was written by Fuse Inventory and 42 Technologies.
Fuse is a demand planning and inventory control platform for fast-growing, multi-channel brands. Fuse Demand Planning builds a separate, daily-updated forecast for each sales channel, generates automated restock recommendations, and ties every inventory decision to a cash-flow forecast. Fuse Inventory Control tracks every SKU, purchase order, shipment, and production run in real time, with built-in support for multi-level BOMs, components, batch and lot traceability, and landed cost accounting. Together, they replace the spreadsheets that stop scaling and the ERPs that aren't the right fit yet, in one connected platform built by planners, for planners.
With a team of retail experts, 42 Technologies is for brands and retailers who need to understand their business and product performance through the unification of data sources. The platform is a retail-specific reporting tool that simplifies and accelerates product driven decision making.